FastAPI application monitoring made easy
Understand how your API is being used and how it's performing without deploying, configuring and maintaining complex monitoring tools.

Let’s assume your team has just shipped a REST API using FastAPI. Now that it’s live you’re looking to implement API monitoring, so you know how the API being used and how it’s performing. You probably have questions like:
- How many requests is the API handling, by how many consumers?
- Which features of the API are being used the most, and by whom?
- Are there any errors faced by consumers, and what types of errors?
- What does the performance look like? Where are the bottlenecks?
- Is the API up & available to users at all times?
Out of the box, FastAPI doesn’t provide any means for you to answer those kinds of questions. And it shouldn’t. It’s a web framework, not a monitoring solution, after all. There are many different ways to approach this, but let’s dive into a couple of options.
Prometheus and Grafana
If you search around the internet, you will likely find recommendations for setting up Prometheus and Grafana to monitor your application. These are widely adopted open-source tools for monitoring all sorts of things, and they can certainly help you achieve what you’re after.
This approach can be powerful and versatile, allowing you to implement features like custom metrics and infrastructure monitoring all within the same platform while tailoring everything exactly to your needs.
However, Prometheus and Grafana aren’t exactly plug-and-play solutions. You will need to invest a fair bit of time to learn and set things up, especially if you haven’t used them before. Some of the steps include deploying and configuring both tools, implementing metrics logging using the Prometheus client in your application and then building dashboards in Grafana. Also, remember to consider the ongoing costs of hosting and maintaining these tools.
If that makes you wonder “there must be an easier way”, then keep reading.
Apitally
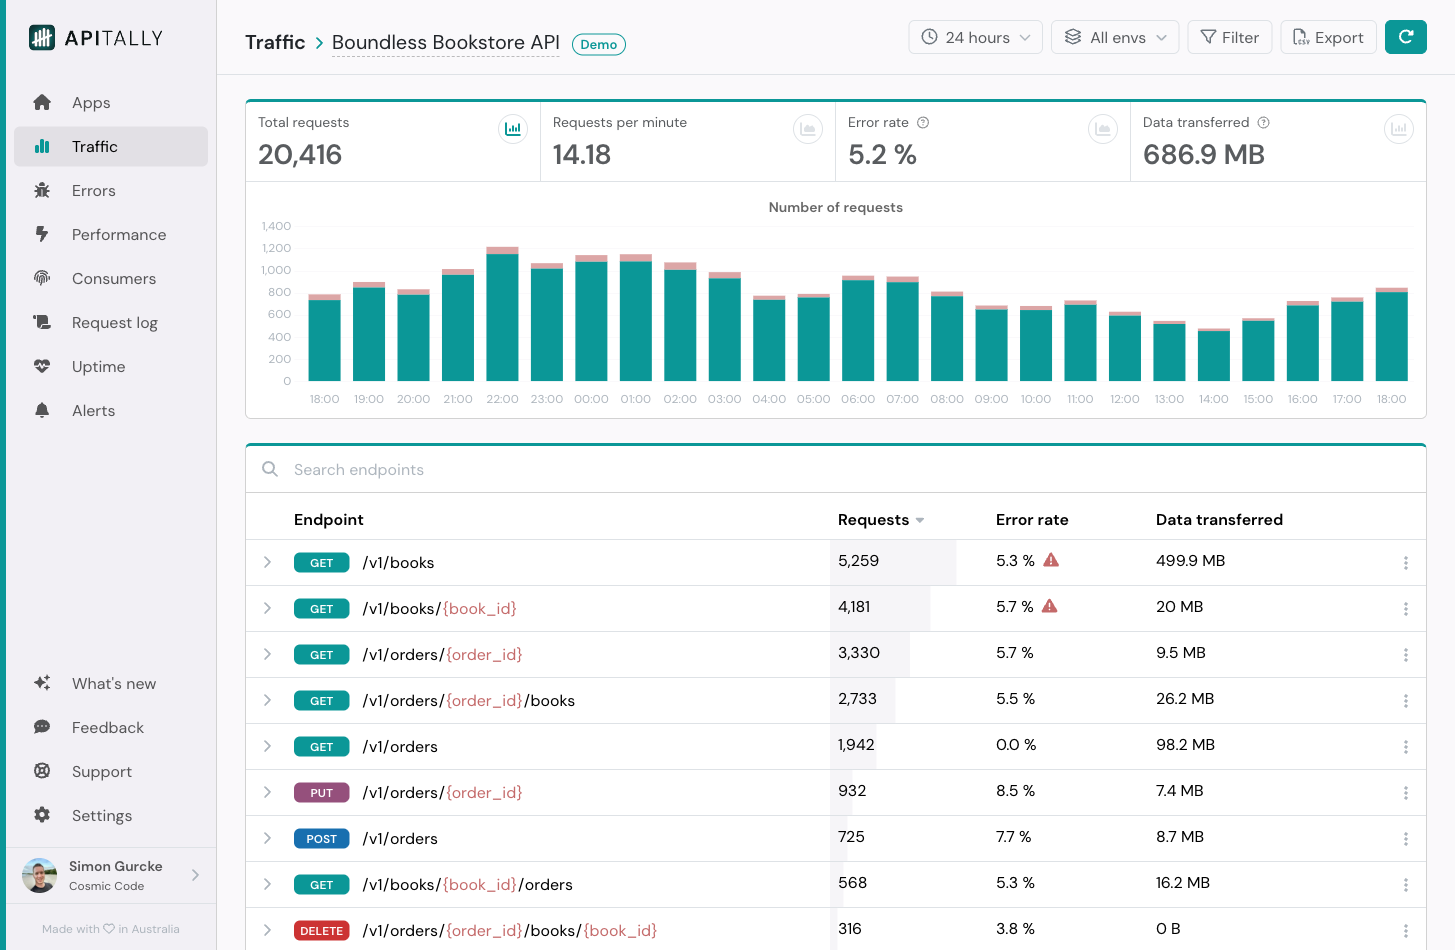
By using a purpose-built API monitoring solution, such as Apitally, you can get access to valuable API traffic, error and performance insights within just a few minutes. This is possible because Apitally’s client library was specifically built to capture the most important API metrics for FastAPI applications. It also provides an intuitive API monitoring dashboard out of the box.
The data automatically captured by Apitally includes metadata about your API endpoints as well as all requests and responses. For example:
- Number of requests handled per endpoint
- Response status codes, including client and server errors
- Validation errors (from pydantic)
- Response times / latencies
- Request and response payload sizes
- Consumer identifiers (if configured)
This data syncs from your application to Apitally every minute, so you can easily keep track of those API metrics in near real-time using the Apitally dashboard. And as a bonus, Apitally will also monitor the uptime & availability of your API and send you alerts when something is wrong.
To set this up you only need to install a small dependency and add a couple of lines of code to your project, as shown in the example below.
from fastapi import FastAPI
from apitally.fastapi import ApitallyMiddleware

app = FastAPI()
app.add_middleware(
    ApitallyMiddleware,
    client_id="your-client-id",  # provided by Apitally
    env="prod",  # or "dev" etc.
)
The middleware works asynchronously and does not impact the performance of your application. It also doesn’t capture request and response headers and bodies, which means you don’t have to worry about masking sensitive information that may be present in your API payloads.
Identifying consumers
You might find it useful to analyze API requests by consumer, so you can understand the different usage patterns of
individual consumers. To allow that, you can optionally associate requests with consumers in your application by setting
the consumer_identifer property on the request.state object.
As an example, if your application is using authentication, you could set the consumer_identifer based on the
authenticated user.
You could do this anywhere within your existing authentication code, or in a dedicated function, like in the example below.
def identify_consumer(
    request: Request,
    current_user: Annotated[User, Depends(get_current_user)],
):
    request.state.consumer_identifier = current_user.username

app = FastAPI(dependencies=[Depends(identify_consumer)])
Conclusion
While not as versatile and customizable as managing your own monitoring stack, using a tool like Apitally can help you gain valuable API insights with a minimal amount of effort. And sometimes a simple solution is all you need.
If you’d like to try Apitally out for your FastAPI project, you can follow the detailed setup guide for FastAPI. You should be good to go in less than 5 minutes.
Happy monitoring!